Welcome to Mission Control. The Schema Pillar Pro Dashboard gives you a high-level, data-dense overview of your website's entire semantic architecture and health.
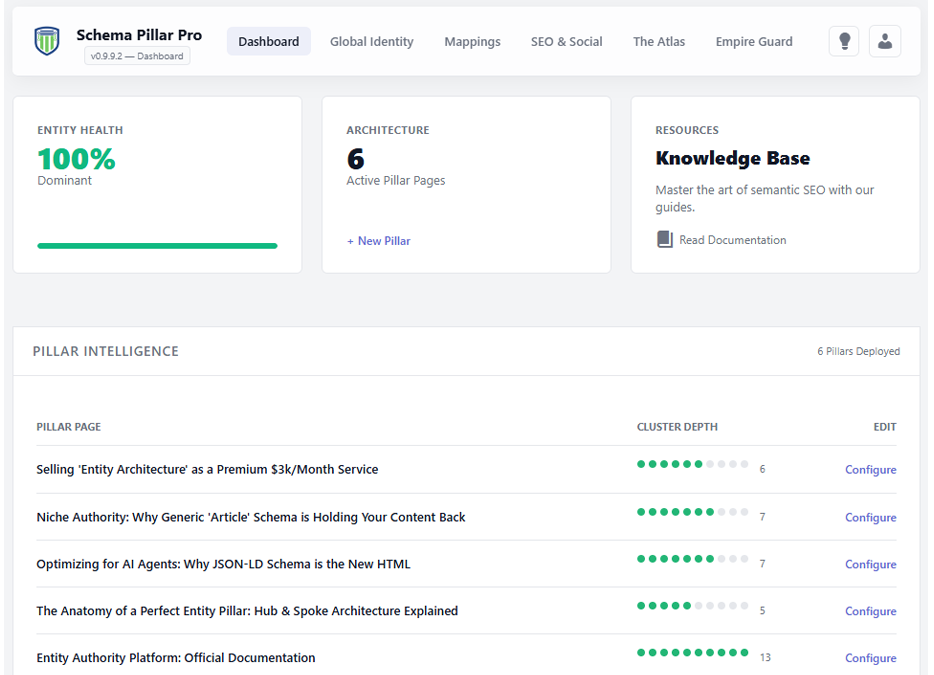
At the top of your dashboard, you will find three primary metric cards that track your overall progress.
This is a global calculation of your site's schema coverage and quality. It grades your performance from 0 to 100%. Red indicates critical missing data, Yellow means your architecture is stabilizing, and Green indicates a dominant, highly authoritative Entity Graph.
A live count of the total number of Active Pillar Pages currently deployed on your website. Use the quick link here to instantly spin up a new Pillar structure.
This table acts as your directory for all active Hub & Spoke architectures. It lists every Pillar Page on your site alongside its Cluster Depth.
The visual dot-matrix shows you exactly how many supporting cluster articles are actively linked to that specific Pillar. This allows you to quickly identify "thin" pillars that need more supporting content.
Your dashboard adapts to your license level: